Careers Pt 3 - Visualizing Progressions
In part 1 I talked about how your “level” or title was just a way to describe the scope of influence you had. Just a measure of how much your work, and how you worked, impacted others. Part 2 explained more about what I meant by “scope”. What the parts of scope were and how scope could grow.
Being able to describe how that works is crucial to managing your career. Just as important is being able to describe it to others and to visualize it. That lets you discuss it with others. Because while you’re responsible for your own career, you aren’t alone in a vacuum. Being able to visualize where you are in your career and your progression through your career lets you understand where you think your gaps and opportunities are and compare them to what those around you think.
To that end, I’ve been playing around with a bunch of different visualization formats. I wanted to show 3 different values for each of 6 different areas in one place. I tried text, line graphs and bar graphs, but none of them really captured what I wanted. Eventually I settled on a radar plot with an overlay and accompanying text.
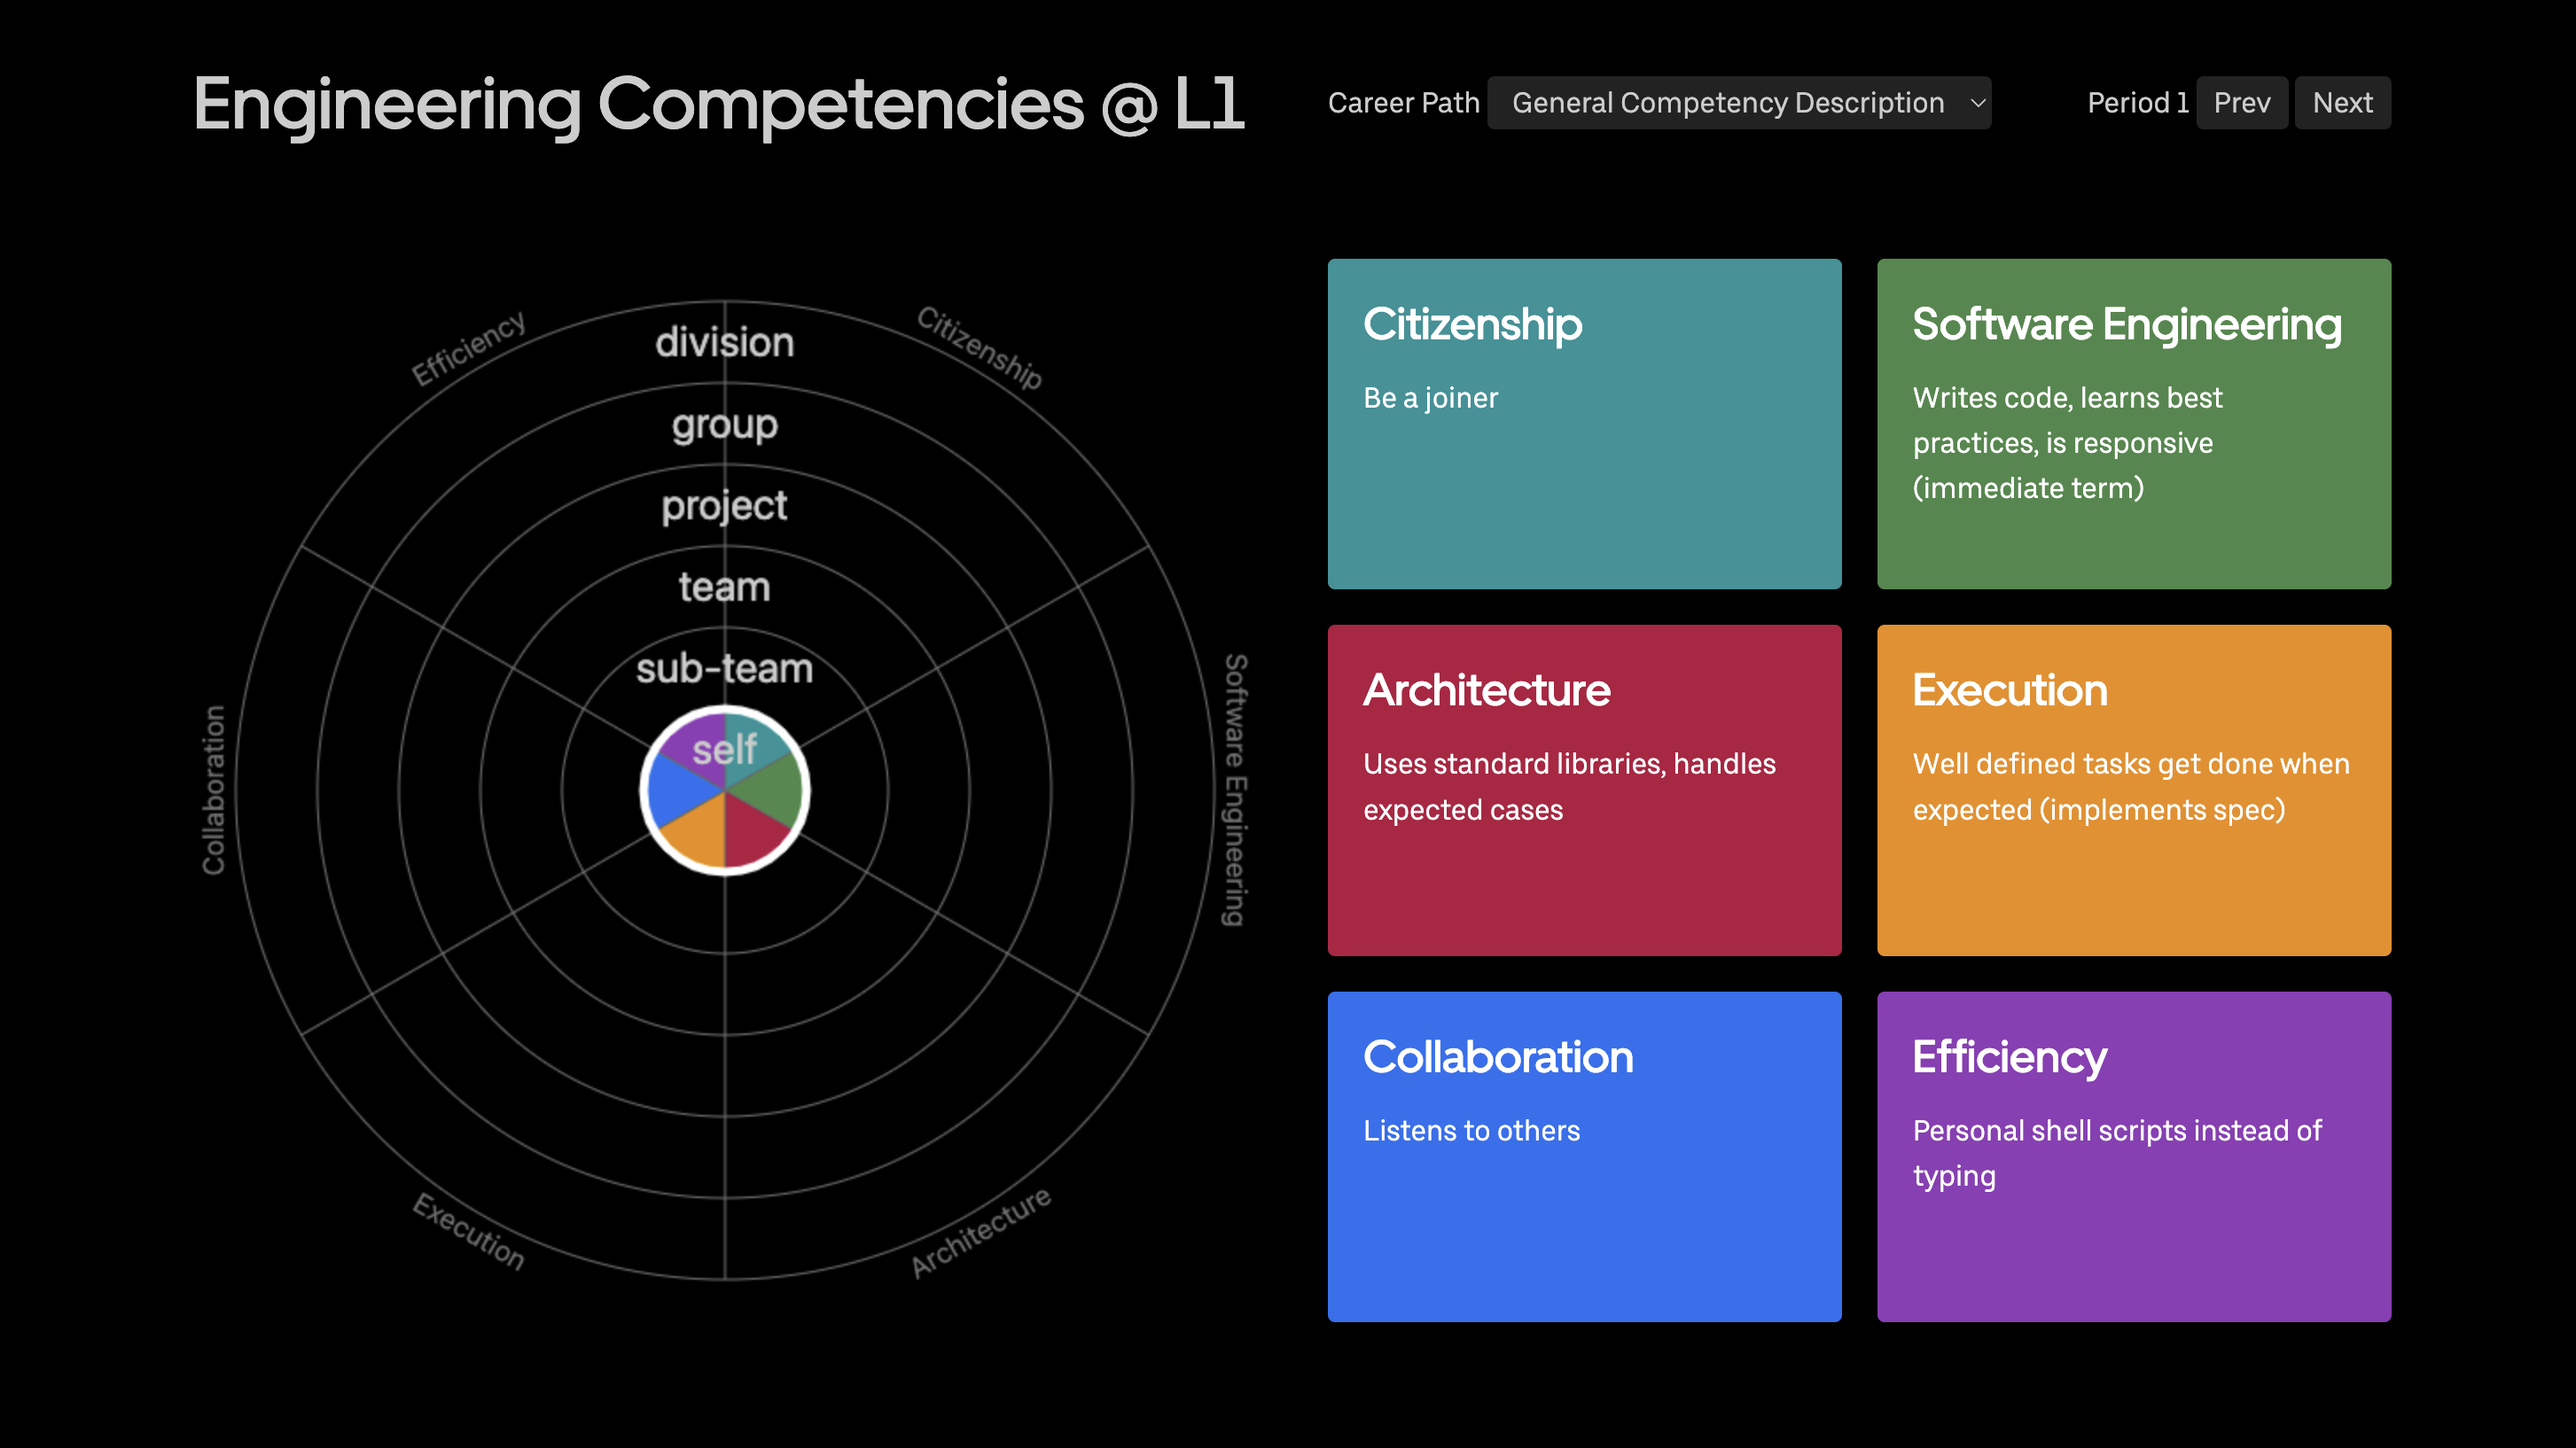
The radar plot breaks the circle down into the 6 “competency” areas. The different rings represent the scope of influence for each level (self, sub-team, team, project, group, or division). Then, for each section of the circle the colored arc represents what you (or whomever is creating the plot) considers your scope of influence. Finally, you can overlay a circle on the plot with your current level. The text area gives you a place to describe significant information/events that led you to pick that particular scope of influence for that area. I’ve put together a progression of radar plots that lay out expectations in each area at each scope.
Where this gets really interesting and useful is when you use it to manage your career. Pencil in where you are on the radar plot. Then get your manager to do the same. Once you have both, compare them to expectations. If both you and your manager agree you’re exceeding expectations in all areas then you have an easy discussion about next steps. If you and your manager agree and there’s a gap between where you are and expectations then the conversation is still pretty easy. Identify the gaps and discuss what you can do more/less of or new areas to move into to close that gap.
If you and your manger disagree on where you are then you have a harder conversation, but it’s the one that’s probably most important. Making sure the two of you are on the same page is the single most important thing to managing your career. Those gaps indicate places where the two of you aren’t on the same page, so that’s what you need to be talking about. It might be expectations. It might be visibility. It might just be lack of awareness. Whatever it is, now that you know about it you can (and should) do something about it.
Finally, one last things you can do with these visualizations is look at them over time. I put one together for my career. It’s a lot of things, but one thing it’s not is smooth. And that makes sense. Over time, particularly around job changes, you perform at different levels. Don’t be surprised when it happens. In fact expect it. Take the time to look around, identify the gaps, then close them and move on. That’s owning your career.
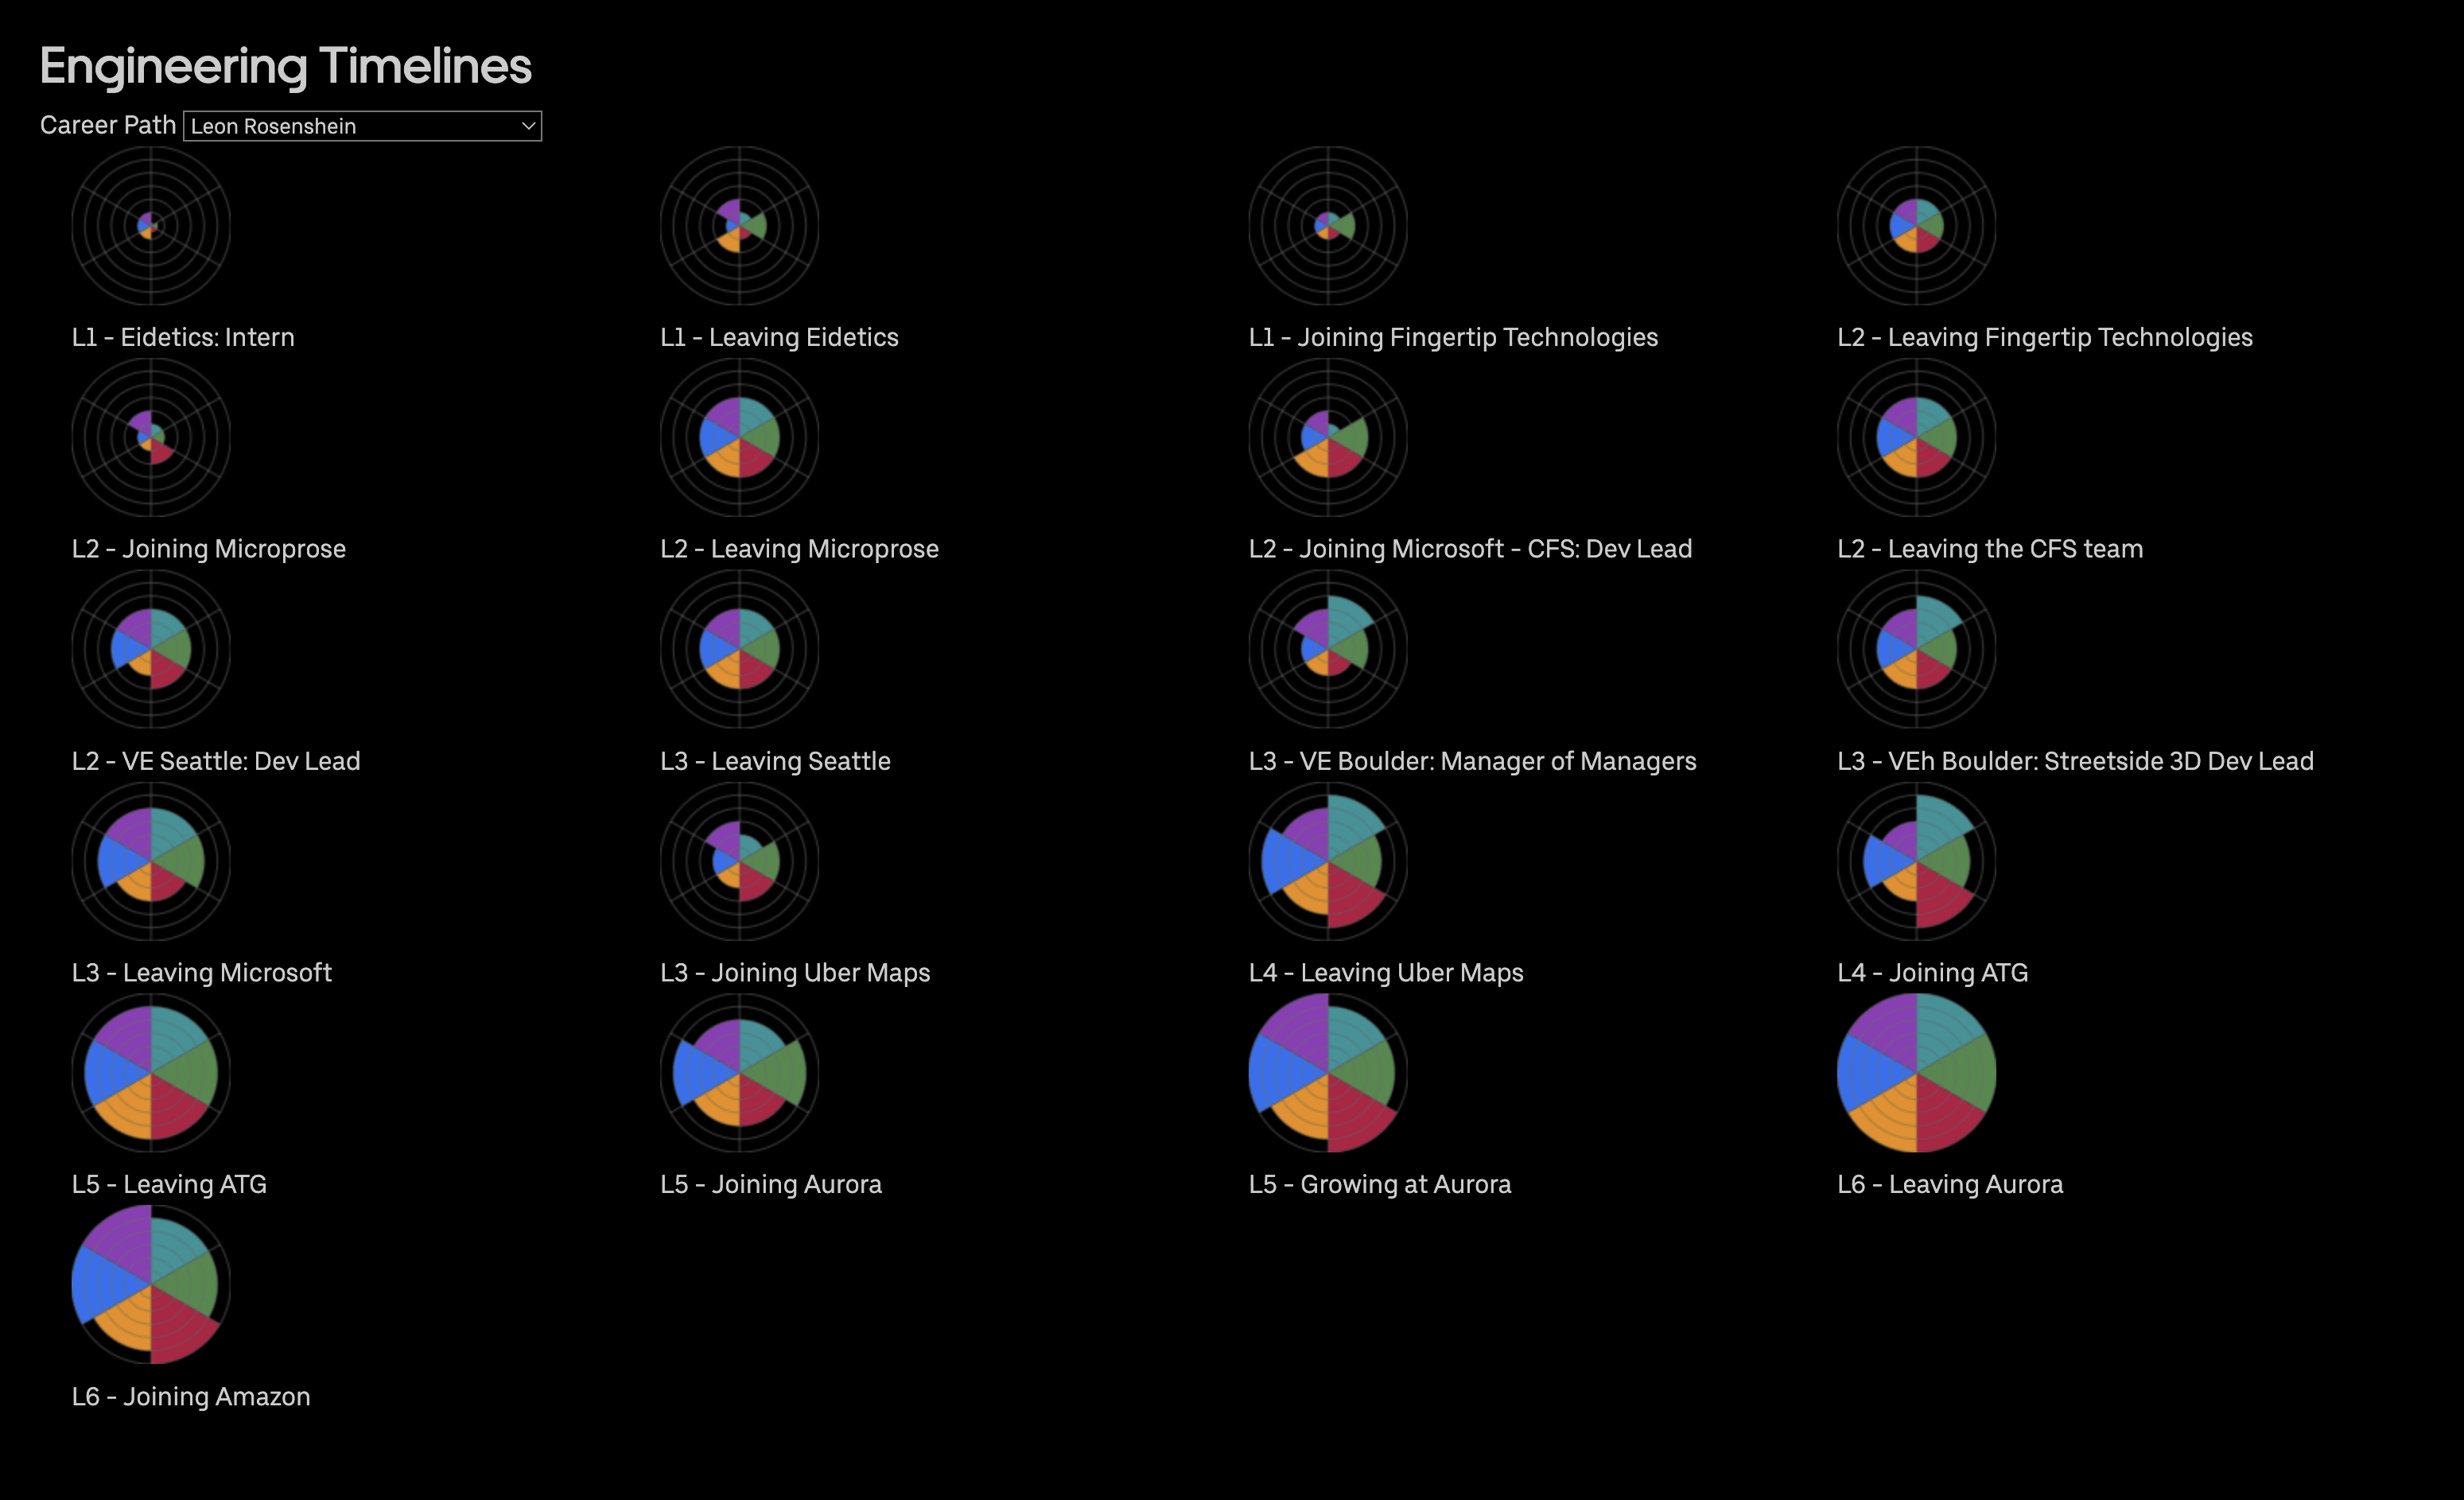
If you’re really interested, you can see my history (and a couple of “generic” career progressions I’m putting together for discussion purposes) in the Eng Stories area.